The greywater ceiling: why rainwater self-sufficiency gets stuck at 26%
The simulated neighbourhood gets stuck around 24 to 26% water self-sufficiency, no matter how large the rain tank. The ceiling is not in storage but in the greywater split: only the toilet and washing machine may run on rainwater, together 36.8% of household demand. Using more rainwater requires different installations, not bigger tanks.
Bigger tanks do not help
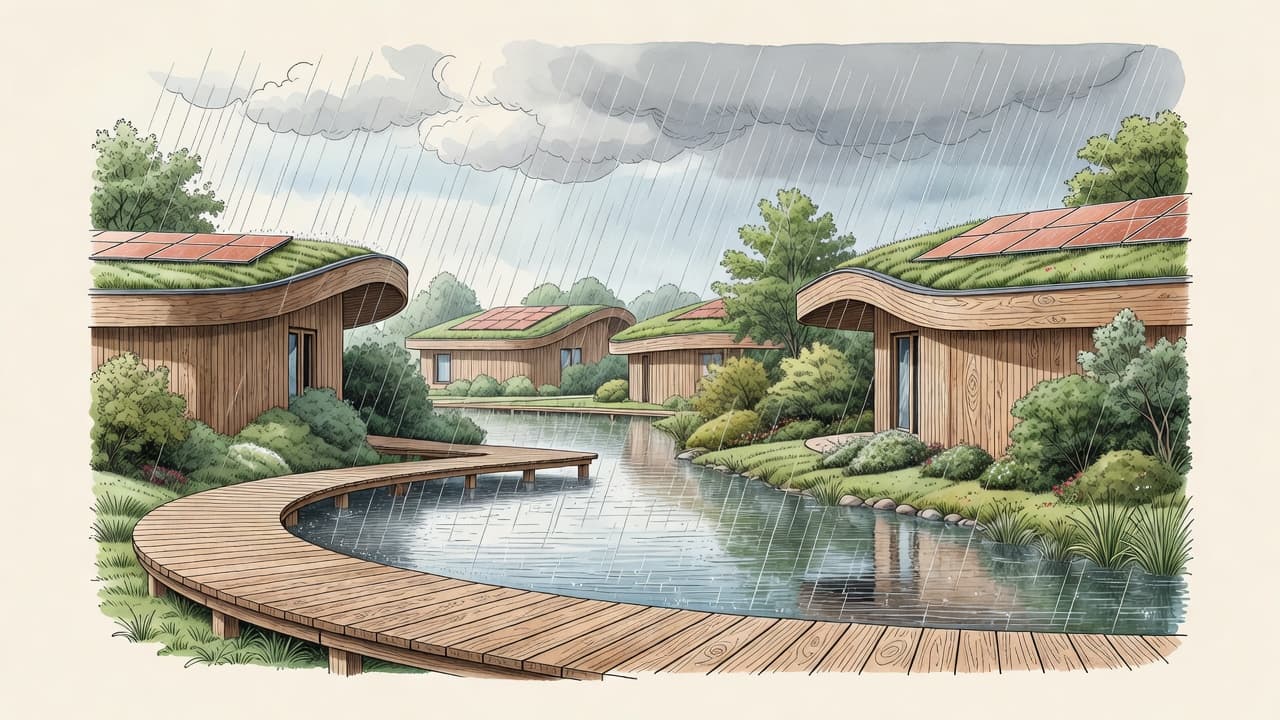
Image above: AI impression, not a construction drawing.
When the water layer of the lab was up and running, I did what every self-sufficiency dreamer would do: enlarge the rain tank. More storage, more autonomy, right?
No. The water self-sufficiency of the simulated neighbourhood stays stuck around 24 to 26%, almost regardless of tank size. The simulation runs hourly, on real Dutch rainfall and evaporation data, and the answer does not change: the dial everyone reaches for first does almost nothing.
That is exactly the kind of result this lab exists for. Not because it is fun, but because you want to know it before you bury a basement full of tanks.
The ceiling is indoors
The explanation is simple and hard. Without treating it to drinking-water standard, rainwater can only be used in two places inside a home: the toilet and the washing machine. Together they account for 36.8% of household demand. That is the greywater split, and it is a physical ceiling, not an ambition.
A neighbourhood covering 26% of its total water demand from rain is already at over two thirds of what that ceiling allows. The rest of the demand is drinking-water quality: shower, kitchen, taps. Rainwater does not go there unless you treat it to potable standard, which is an entirely different installation with entirely different costs and rules.
A lot of sustainability communication quietly suggests more. That calculation error is now a permanent check in the lab: any run that exceeds the greywater ceiling is by definition a bug.
Drought tests the house, the cloudburst tests the neighbourhood
The second lesson from the water layer: drought and peak rainfall are two different problems fighting over the same pond.
The real 2018 drought year gives the neighbourhood 105 stress days, against 85 in 2022. And 2022 was itself a dry year; the honest comparison with a wet year is still on the research list.
At the same time, that same retention pond needs spare capacity during a summer cloudburst, otherwise the surplus overflows into the sewer. That overflow, in cubic metres per year, may be the most important number of the entire water layer: it is the language in which municipalities talk about climate adaptation, and the dial through which a neighbourhood design can contribute to relieving the sewer system.
What this leans on
The edges of this result, on the table:
- For household water use at hourly resolution there is no Dutch standard like there is for electricity. The daily profile in the lab is self-built and labelled as an assumption. Whoever validates this with smart water meters one day will own a dataset nobody has.
- Garden irrigation uses the Makkink reference evapotranspiration from solar radiation and temperature, the standard method in Dutch agrohydrology.
- The 36.8% greywater split depends on how household use divides across applications; a neighbourhood with different appliances or habits shifts that share.
The policy translation stands: using more rainwater means thinking in installations, not in tanks. And whoever designs a neighbourhood should size the pond not only for the drought, but also for the cloudburst that follows it.