Blog
Latest insights from SolarPunkLab

The winter wall drops off the Alps
Exactly the same neighbourhood, computed at five European locations: Breda, Ghent and Munich share the same winter wall and the same harshest year (2010), but south of the Alps the wall collapses. In Milan the neighbourhood earns money up to 80%; in Palermo 90% self-sufficiency costs 68 euros per home per year, without seasonal storage.

The number that does not exist
My crossover model leans on a parameter that exists nowhere in the literature: the learning curve of construction automation. The reconstructed band is 8 to 15% per doubling of automated volume, 10% central, and it is explicitly built to be refuted.

The model versus the field: 3.53 against 3.52
My heat pump model predicts a seasonal efficiency of 3.53; Dutch field monitoring across six thousand homes measures 3.52. But the validation also produced an uncomfortable discovery: not a single Dutch showcase project publishes a measured self-sufficiency figure.

The battery that rusts: my most expensive assumption finally got sources
The price of seasonal storage carried the whole model on a single market indication. One day of source research later: neighbourhood-scale hydrogen is commercially disappearing, and the world's first grid-connected iron-air battery runs in Delft, in containers of which two would form my entire seasonal store.

The winter of 2010: how my robust neighbourhood fell through
A neighbourhood sized robustly on three weather years meets its 90% promise in 8 of the 15 years between 2005 and 2023. The cold winter of 2010 is the real yardstick: 82.5% instead of 90%, and covering that year takes nearly double the seasonal store.

I let an optimizer loose on my neighbourhood model and it became an energy trader
When I let an optimisation model with perfect knowledge of the whole year loose on my neighbourhood, with net metering on, it stopped designing a neighbourhood and started trading: import cheap, export expensive, let the battery dance on it. Sizing the installation became irrelevant. The same net metering that earlier only distorted the business case now dominated the entire outcome.

The crossover model: when does building new become cheaper than renovating?
In the model, the costs of building new and renovating cross somewhere between 2039 and 2054. Around 2039 under aggressive construction automation, around 2043 moderate, and even without automation around 2054 on the rising grid-cost path. The starting condition is deliberately that renovation wins today; if you find a crossover, you set the assumption about construction automation yourself.

The greywater ceiling: why rainwater self-sufficiency gets stuck at 26%
The simulated neighbourhood gets stuck around 24 to 26% water self-sufficiency, no matter how large the rain tank. The ceiling is not in storage but in the greywater split: only the toilet and washing machine may run on rainwater, together 36.8% of household demand. Using more rainwater requires different installations, not bigger tanks.
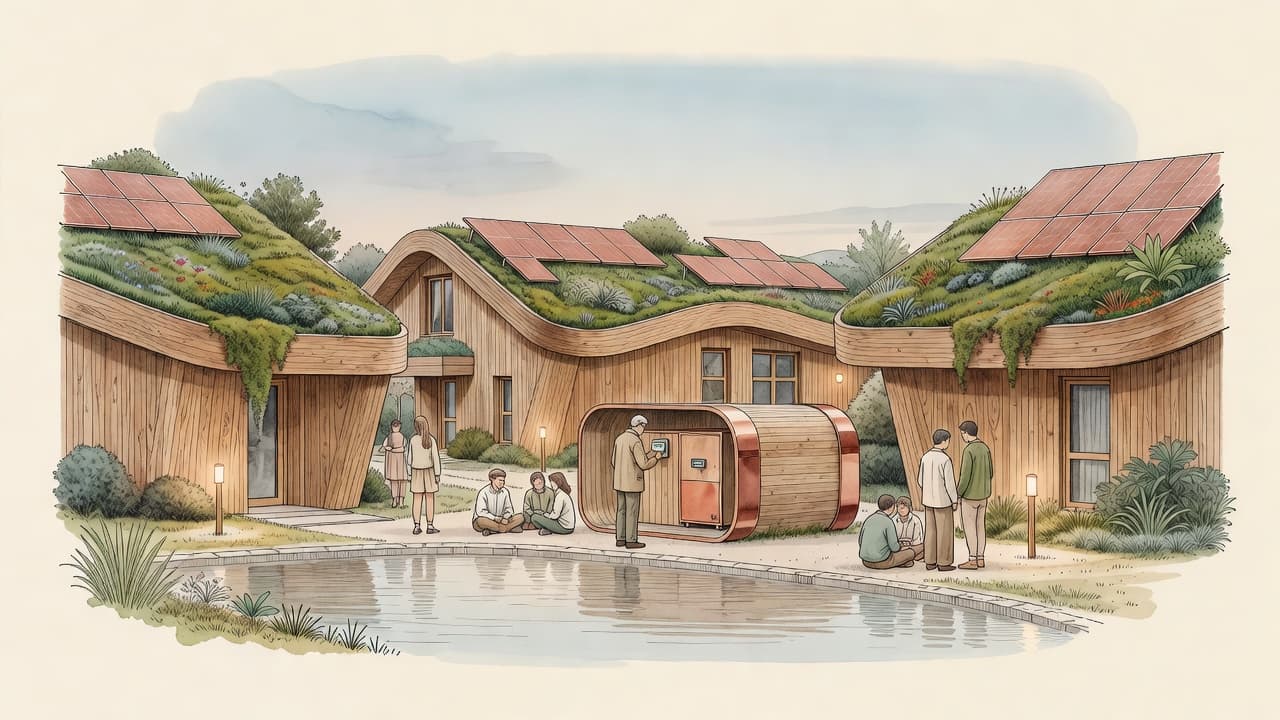
The commons leak: what a free rider costs your energy community
In the simulated energy community, a free rider under an open pool draws a net 363 kWh per year more from the shared battery than a regular participant. Pro-rata contribution rules halve that to 204 kWh; under pricing with graduated sanctions, free riders pay for it and adjust. Rules are not paperwork: a load-shifting agreement alone lifts self-consumption from 38.7 to 40.1%.

The winter wall: why 80% energy self-sufficiency is affordable and 90% is not
For an all-electric neighbourhood of eight households, 80% self-sufficiency costs about 6,100 euros per year, but 90% costs 117,000. That jump is the winter wall: solar output disappears exactly when the heat pumps demand the most, and daily batteries cannot bridge that gap.

Factor 9: how seasonal storage breaks the winter wall
With seasonal storage, 90% self-sufficiency for the simulated neighbourhood drops from 117,000 to 12,900 euros per year, a factor of 9. But the same installation reaches only 56% instead of 90% without smart control: buying seasonal storage without a control strategy leaves most of the value on the table.